Analyse your audience enhancement with our presentation analytics method
Gain presentation insights into to know about the effectiveness of your meetings. And, you can easily share these results with your team any time.
presenters worldwide
active countries
customer ratings
subscribed customers
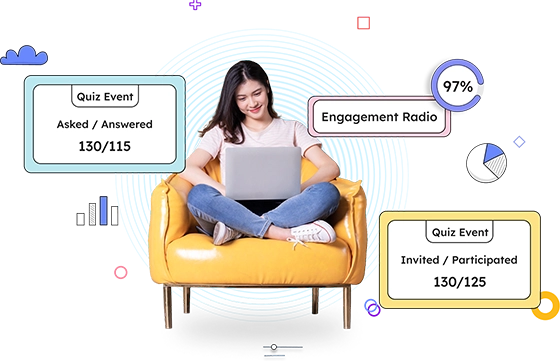
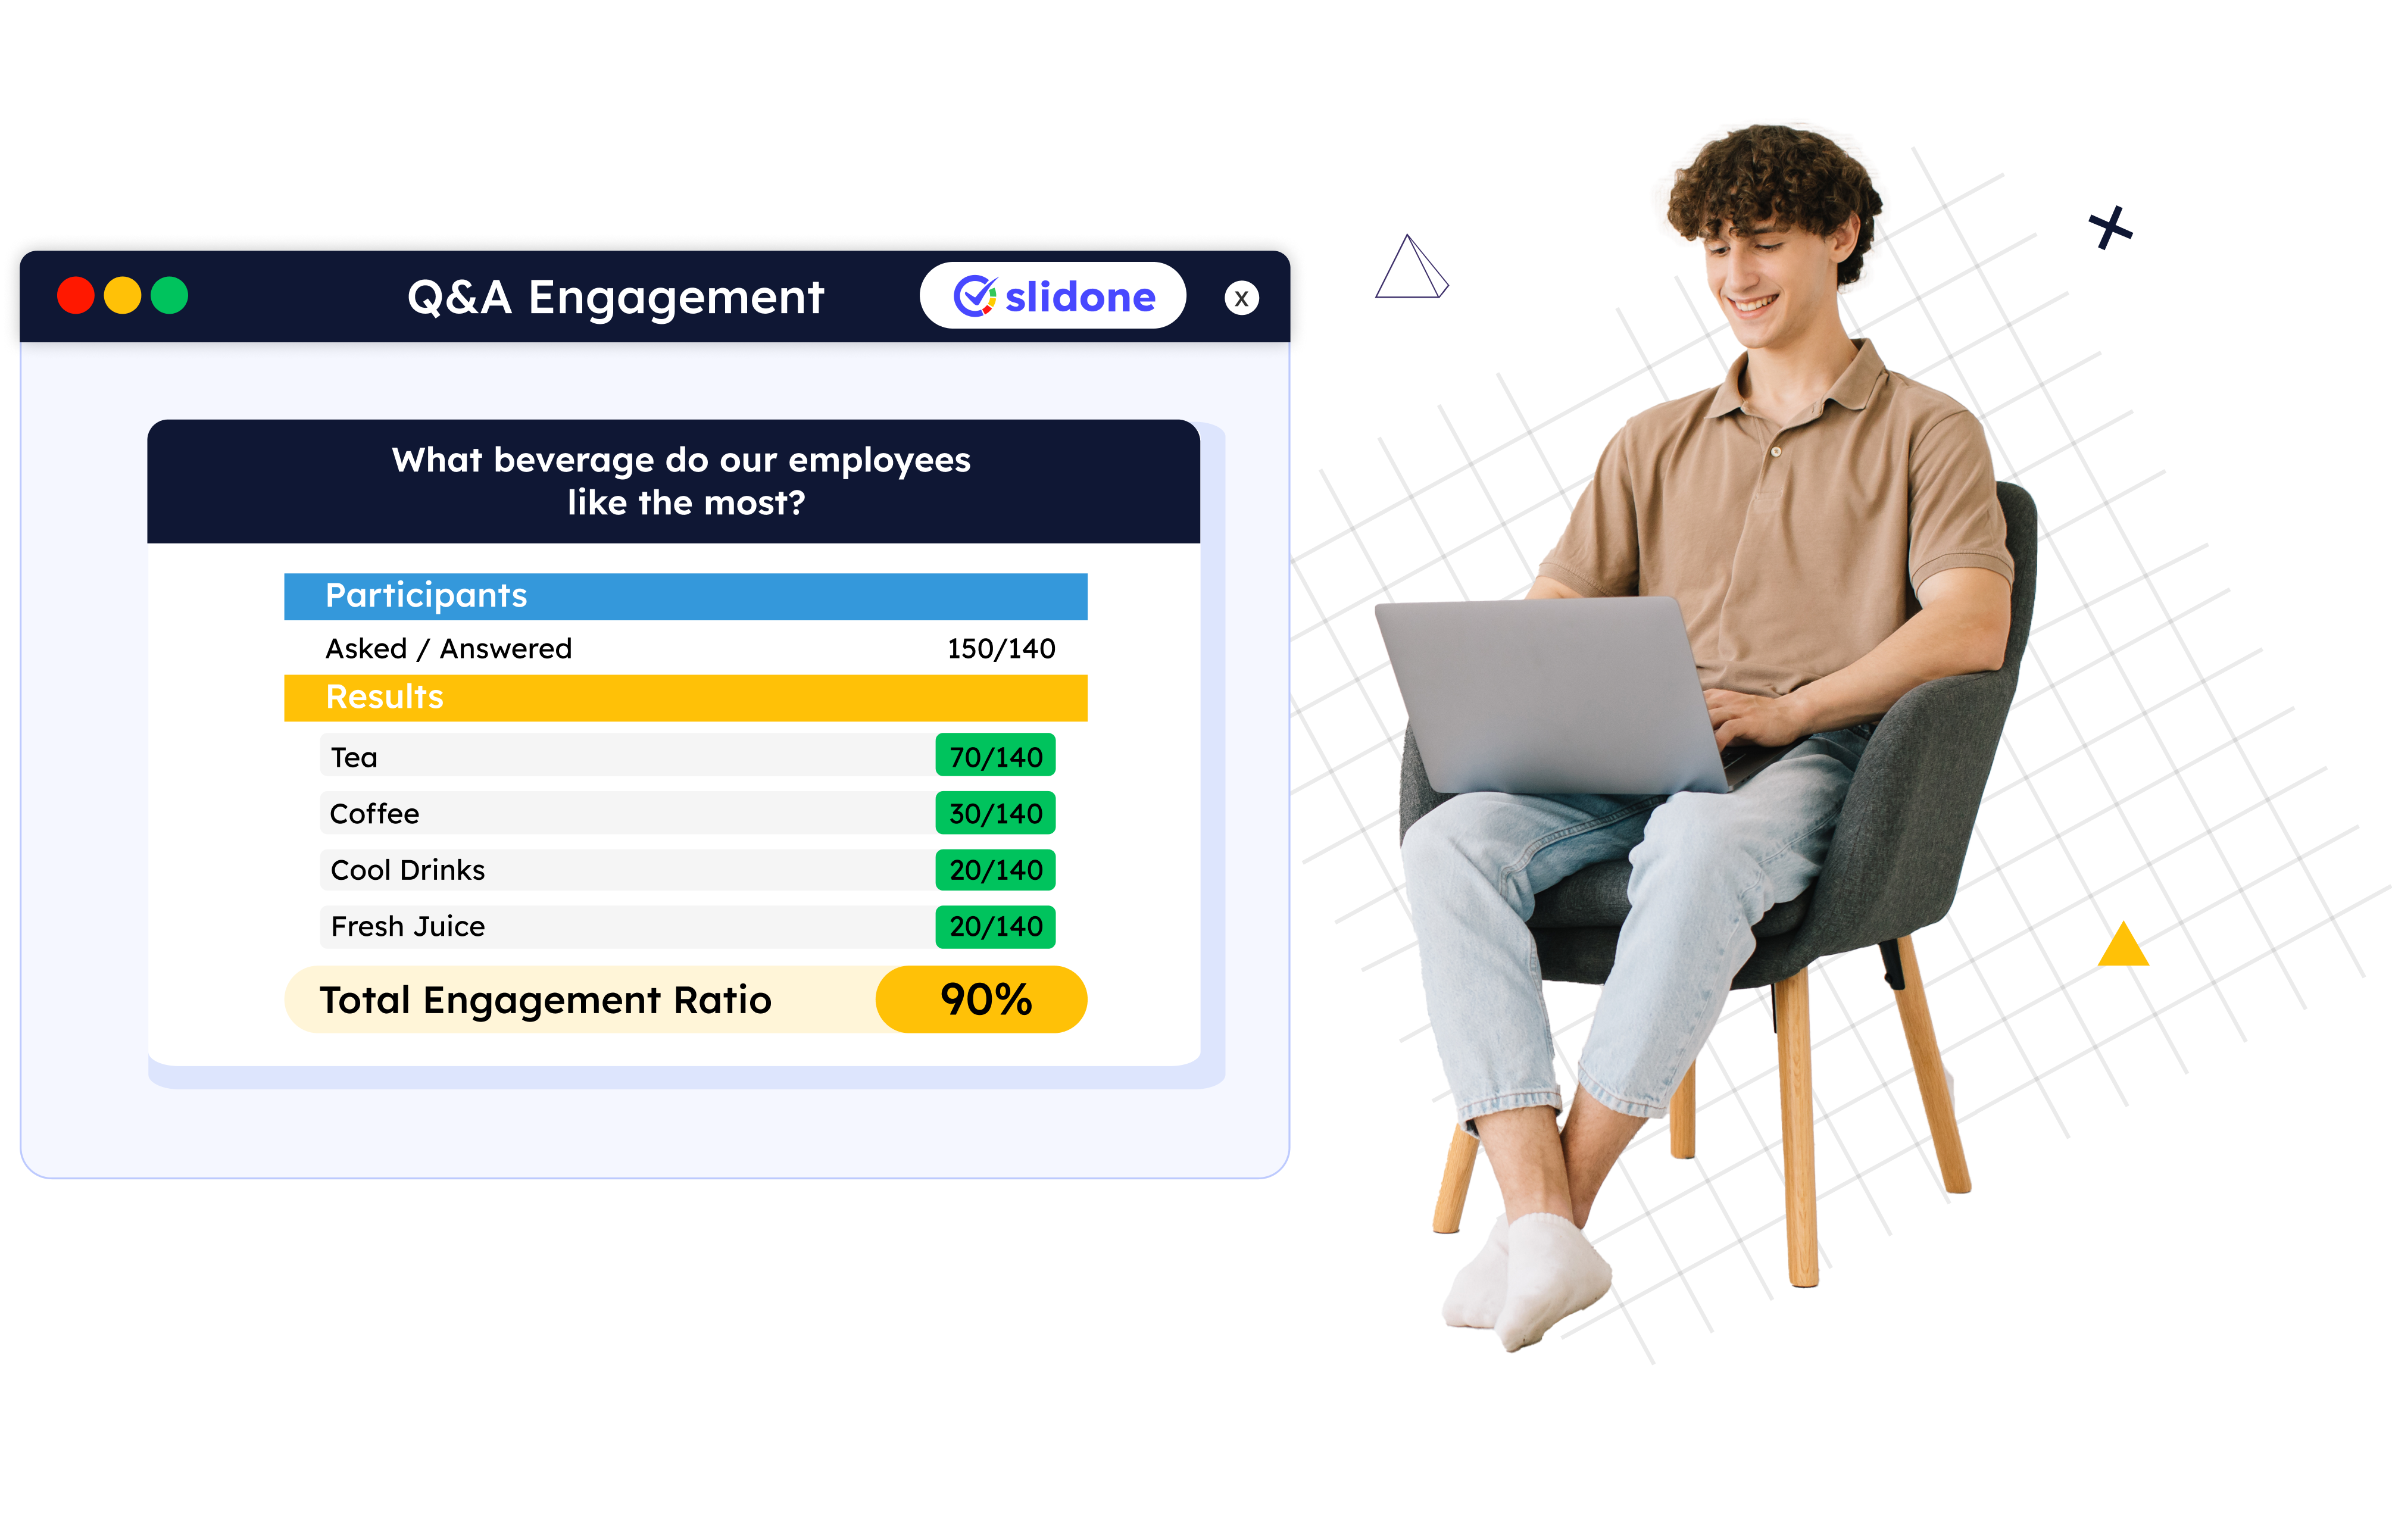
With the scores and rankings in your hand, you can easily analyze your audience’s engagement ratio during your meeting. This helps you to improve your upcoming events and meetings in a better way.
You can generate a custom report, share it with your team and analyze the report to better serve the participants.
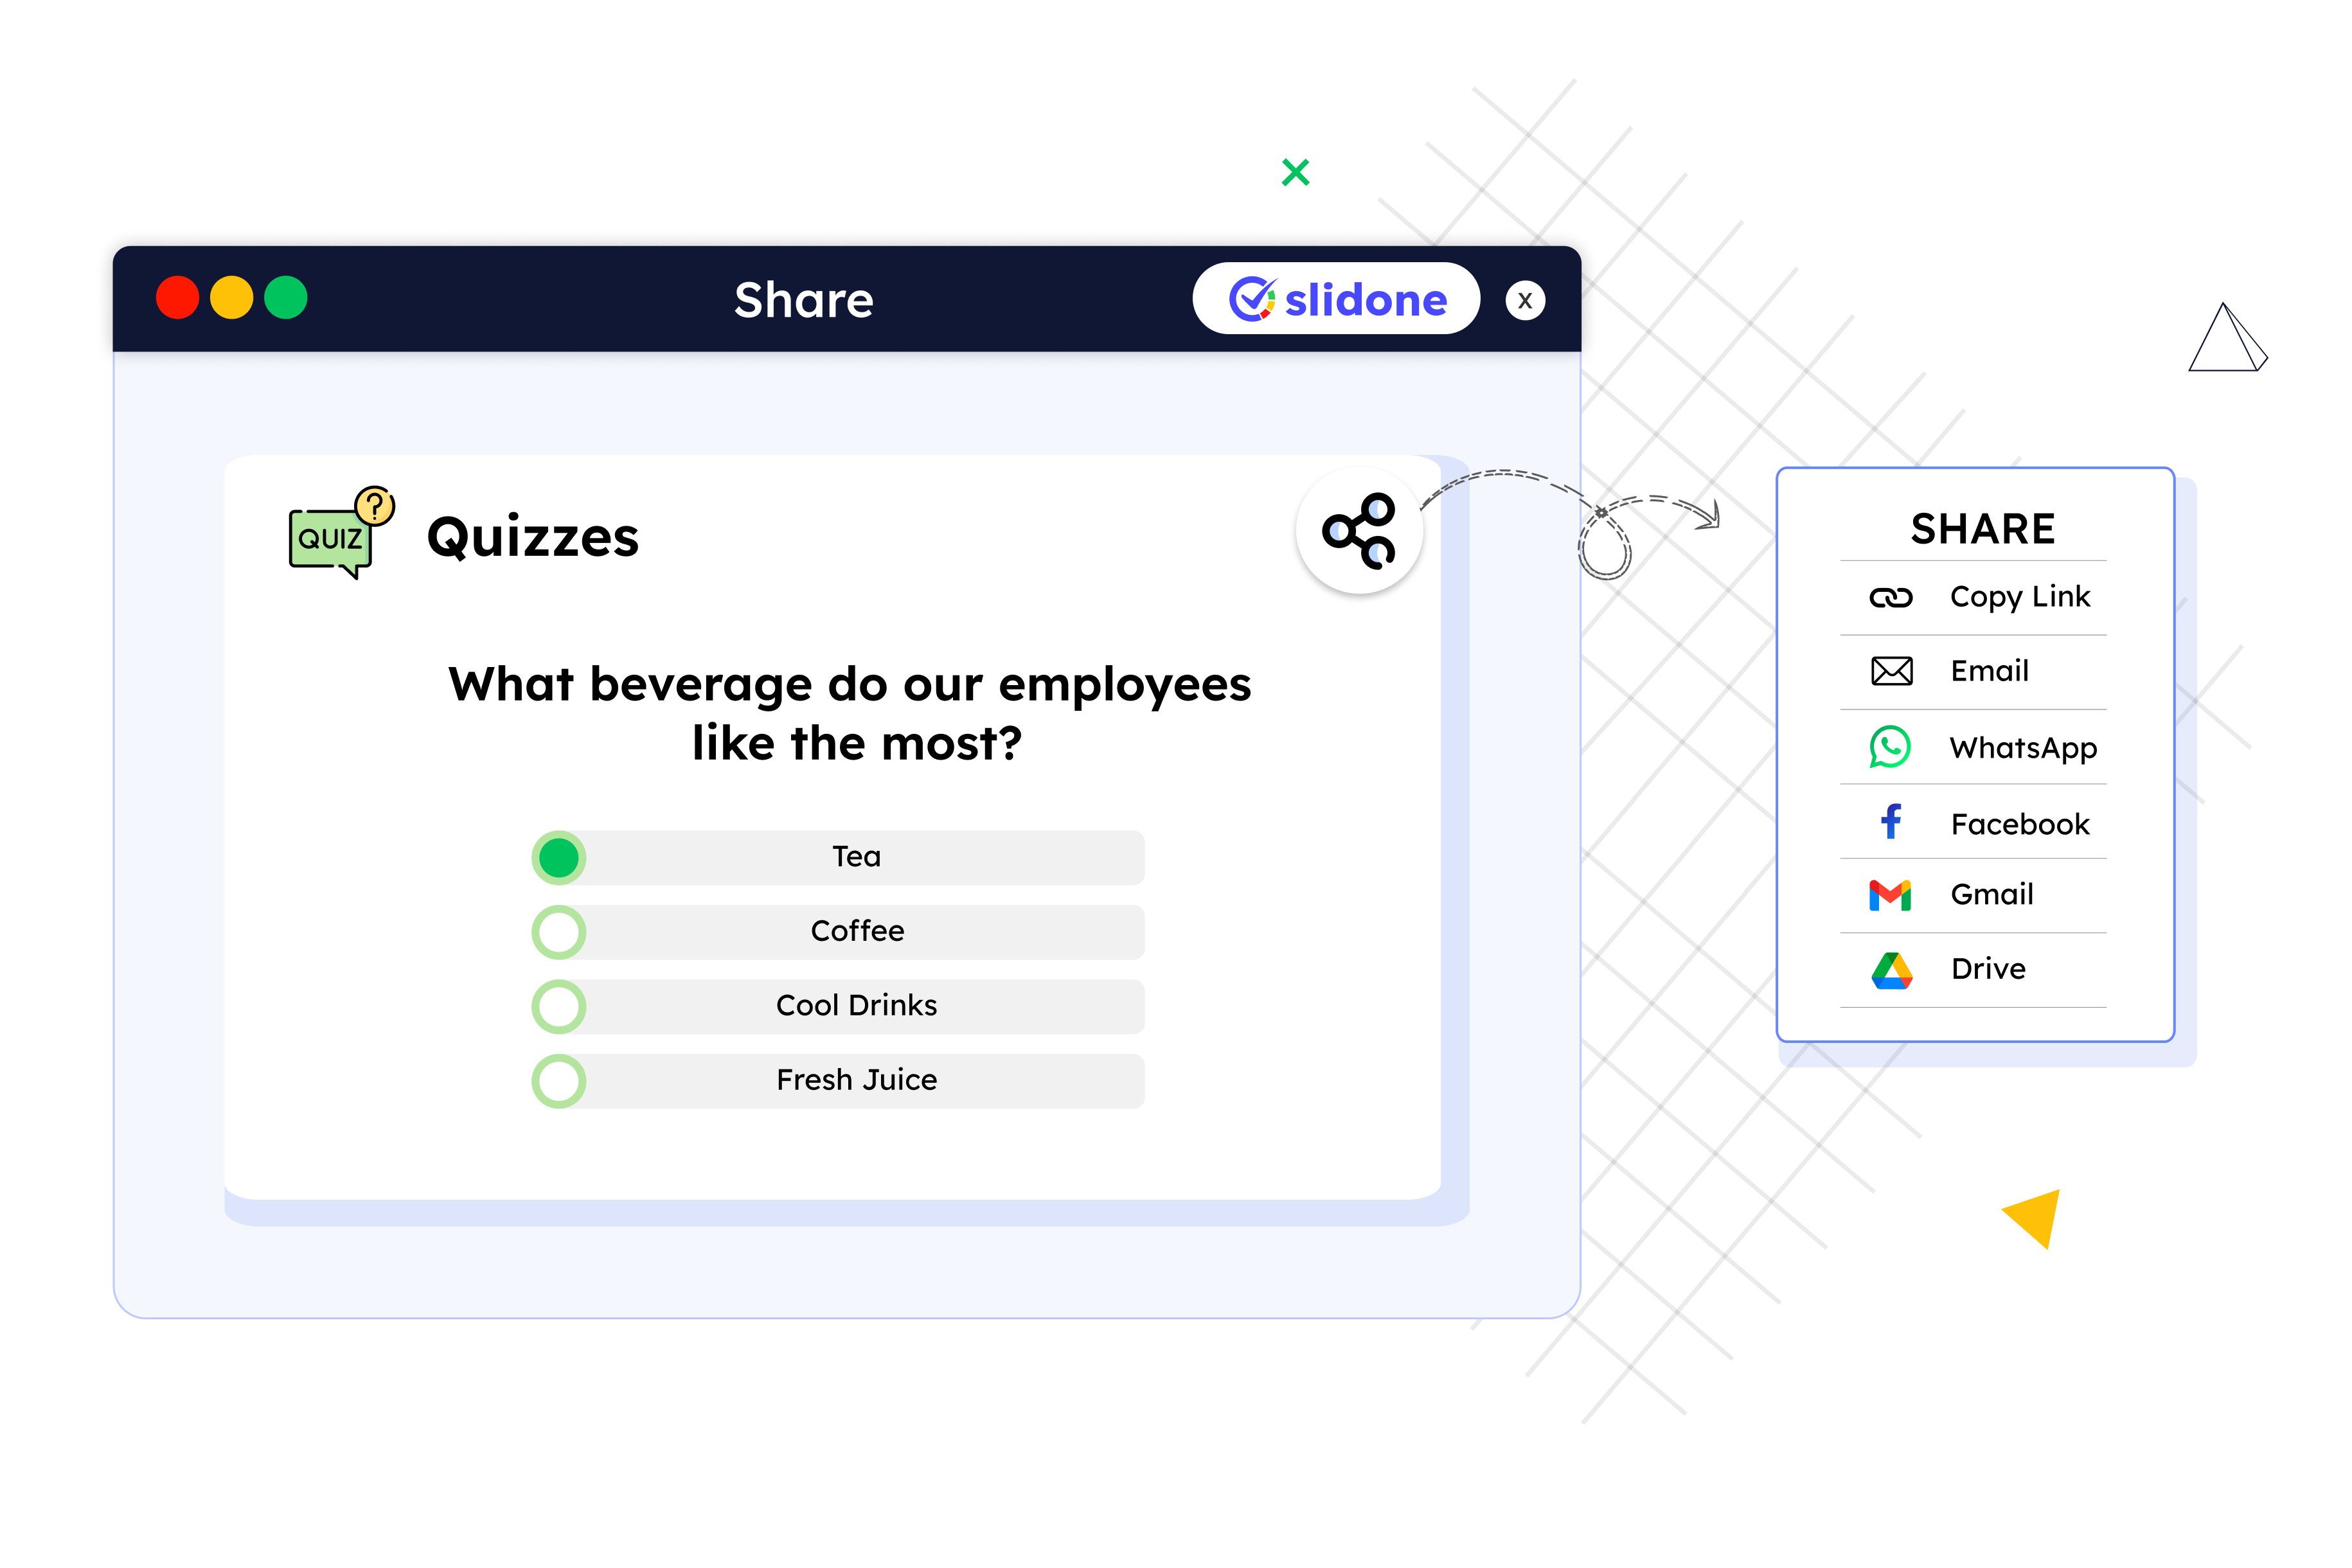
Once the analytics are ready with results, you can share them as images and other supported formats. Better visibility, better engagement!
You can now try our free analytics templates to analyze your results and engagement ratio to better your next event.
Presentation analytics involves the systematic analysis of data generated during presentations to gain insights into audience engagement, content effectiveness, and overall performance. It helps presenters understand what works well and make data-driven improvements for more impactful presentations.
Many presentation solutions offer interactive features like polls, quizzes, and live Q&A sessions, fostering audience engagement. Additionally, advanced analytics within these solutions provide presenters with insights to adjust their approach based on audience responses, ensuring a more dynamic and engaging presentation.
Slidone's analytics features provide valuable insights into audience engagement and feedback during events. These features include poll analytics, Q&A analytics, engagement metrics, feedback, and survey analytics, and user behavior tracking.
As an event organizer, you can access Slidone's analytics by logging into your account on the Slidone website. From there, you can navigate to the specific event for which you want to view analytics and access the relevant reports and data.
Slidone's poll analytics offer real-time results and reports on polls conducted during the event. You can see the voting patterns, results, and trends of each poll question, helping you understand the audience's opinions and preferences on various topics.
Yes, Slidone's Q&A analytics can show you the most popular questions submitted by the audience. Questions with the highest number of upvotes or engagement will be highlighted, allowing you to address the most relevant and popular queries.
Slidone tracks various engagement metrics, such as the number of questions asked, the number of votes cast in polls, the total number of interactions made by attendees, and the overall level of participation during the event.
Yes, you can export Slidone's analytics data and reports after the event. This allows you to perform further analysis, share insights with stakeholders, or include the data in post-event reports.
Yes, most of Slidone's analytics data is presented in real time during the event. This means you can monitor audience engagement and responses as they happen, providing you with immediate insights.
Slidone takes data privacy and security seriously. The data collected through the analytics features is treated with strict confidentiality, and the platform follows industry-standard security measures to protect the data.
Join our PPT experts community
Meet and learn the tips and tricks from creators & companies who share how they use PowerPoint to create better presentations in minutes.